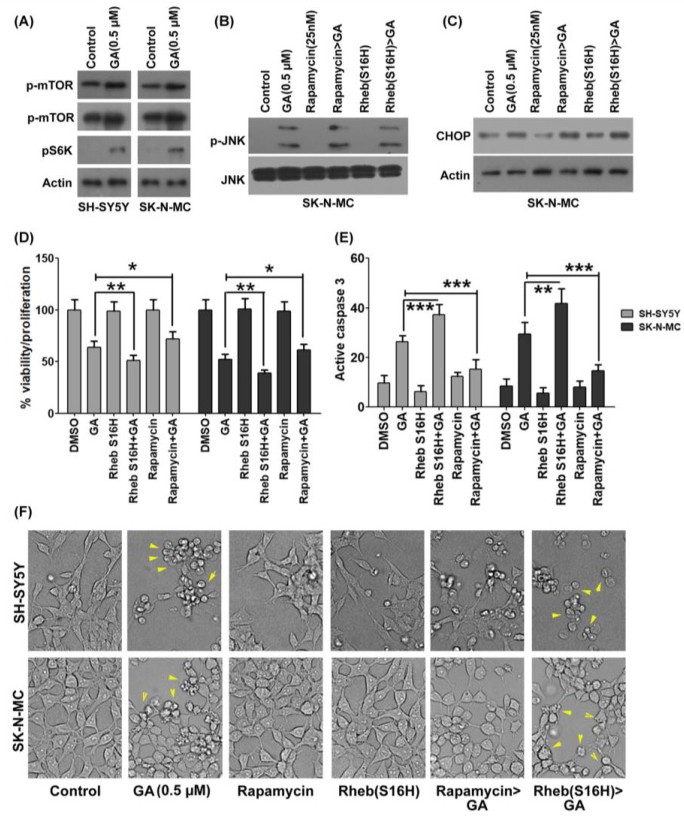
Fig. 4. Gambogic acid-death pathway was partially controlled by the activity of mTOR kinase. (A) SH-SY5Y and SK-N-MC cells were treated with GA for 6 h and phosphorylation of mTORC1 and its downstream protein p-S6K were examined by Western blot. (B-F) SH-SY5Y and SK-N-MC cells were either treated with rapamycin or transfected with Rheb (S16H) and then with GA for 6 h. (B-C) expression of p-JNK and ER stress marker CHOP was evaluated by Western blot. JNK and Actin were used as a loading control. (D) Cell viability/proliferation assay was performed and the relative percentages of viability with proliferation were calculated and plotted as a histogram by using GraphPad Prism 5 software. (E) Caspase-3 activity was determined by indirect staining protocol using a flow cytometer and the data were plotted as a histogram using GraphPad Prism 5 software. (F) Cell morphology of SH-SY5Y and SK-N-MC was imaged to check the apoptotic structure at 40X magnification. Yellow arrows are indicative of the apoptotic cells.